🧪 THE LAB - Weekly Market Digest (Lite)
Week of: Feb 9 – Feb 16, 2026
📊 Performance Snapshot
We track performance using R-based results, a risk-normalized metric that keeps outcomes comparable across assets and volatility.
Period | Trades | Wins | Losses | Win Rate | Net Result |
|---|---|---|---|---|---|
Last 6 Days | 6 | 2 | 4 | 33.3% | –3.08R |
Last 200 Days | 77 | 49 | 25 | 63.6% | +49.76R |
A difficult week in isolation, driven by sharp downside expansion and forced positioning. From a process standpoint, this type of environment is where discipline matters most - and where future edge typically forms.
🌍 Market Context - Forced Selloff, Not Capitulation

Last week’s move was fast, aggressive, and emotionally bearish - the kind of selloff typically seen inside bear markets rather than at their end.
Key drivers:
Heightened macro uncertainty and tariff-related confusion
ETF-linked flow activity rather than retail leverage
One of the largest single-day liquidation events in recent history
Importantly, this was not a classic leverage cascade. Instead, it looks more like institutional de-risking meeting thin liquidity.
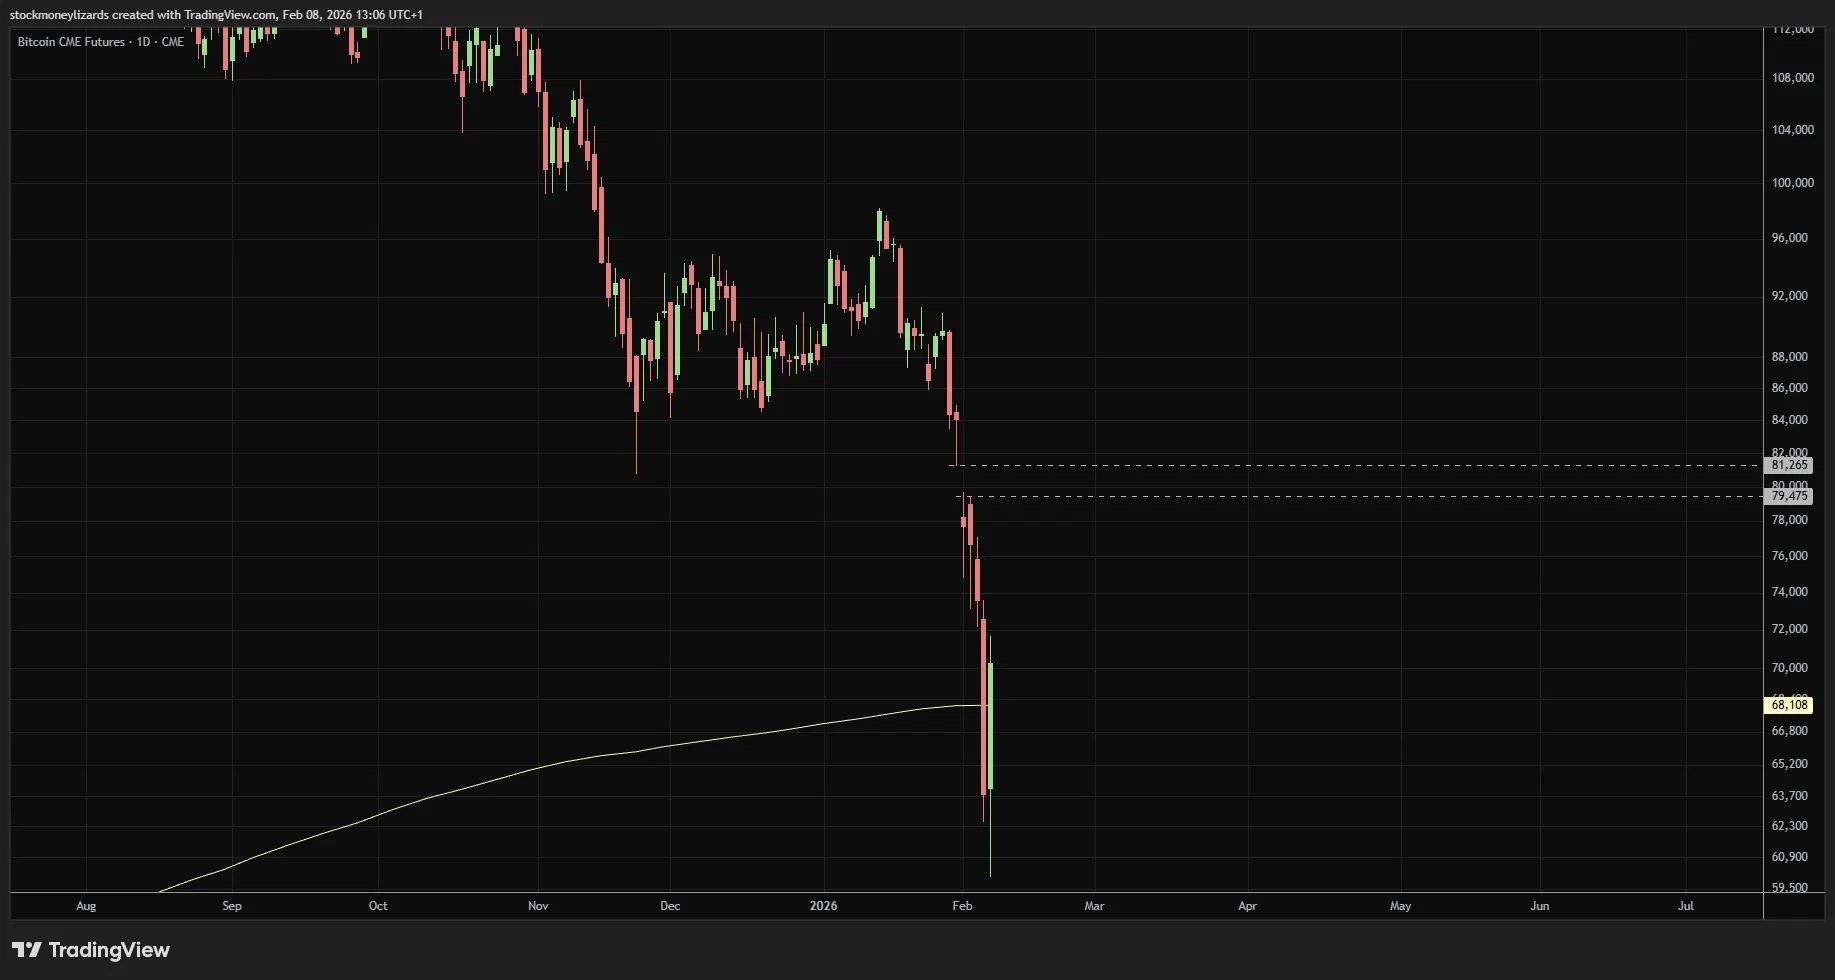
₿ Bitcoin - Bottoming Zone, Not a Reversal

Bitcoin flushed directly into the 75k–80k liquidity pocket, a zone we’ve been highlighting for weeks. That move also coincided with:
A full sweep of local sell-side liquidity
A tag below the weekly EMA200, a level historically associated with early bottoming phases
An open CME gap between ~79k–81k, now acting as a short-term magnet

Our read:
A short-term bounce is likely after the excess selloff
This does not mark the end of the bear market
Expect an extended bottoming phase with choppy, range-bound price action
Another downside wick remains possible before accumulation truly begins
A V-shaped recovery is not the base case.
🔎 What We’re Watching Next
Short-term: BTC stabilizing inside the current range after filling the CME gap
Mid-term: Sideways price action to rebuild structure and liquidity
Risk: Late shorts getting trapped during reflex bounces
Patience matters more than prediction here.
🧭 Altcoin Snapshot (Lite)
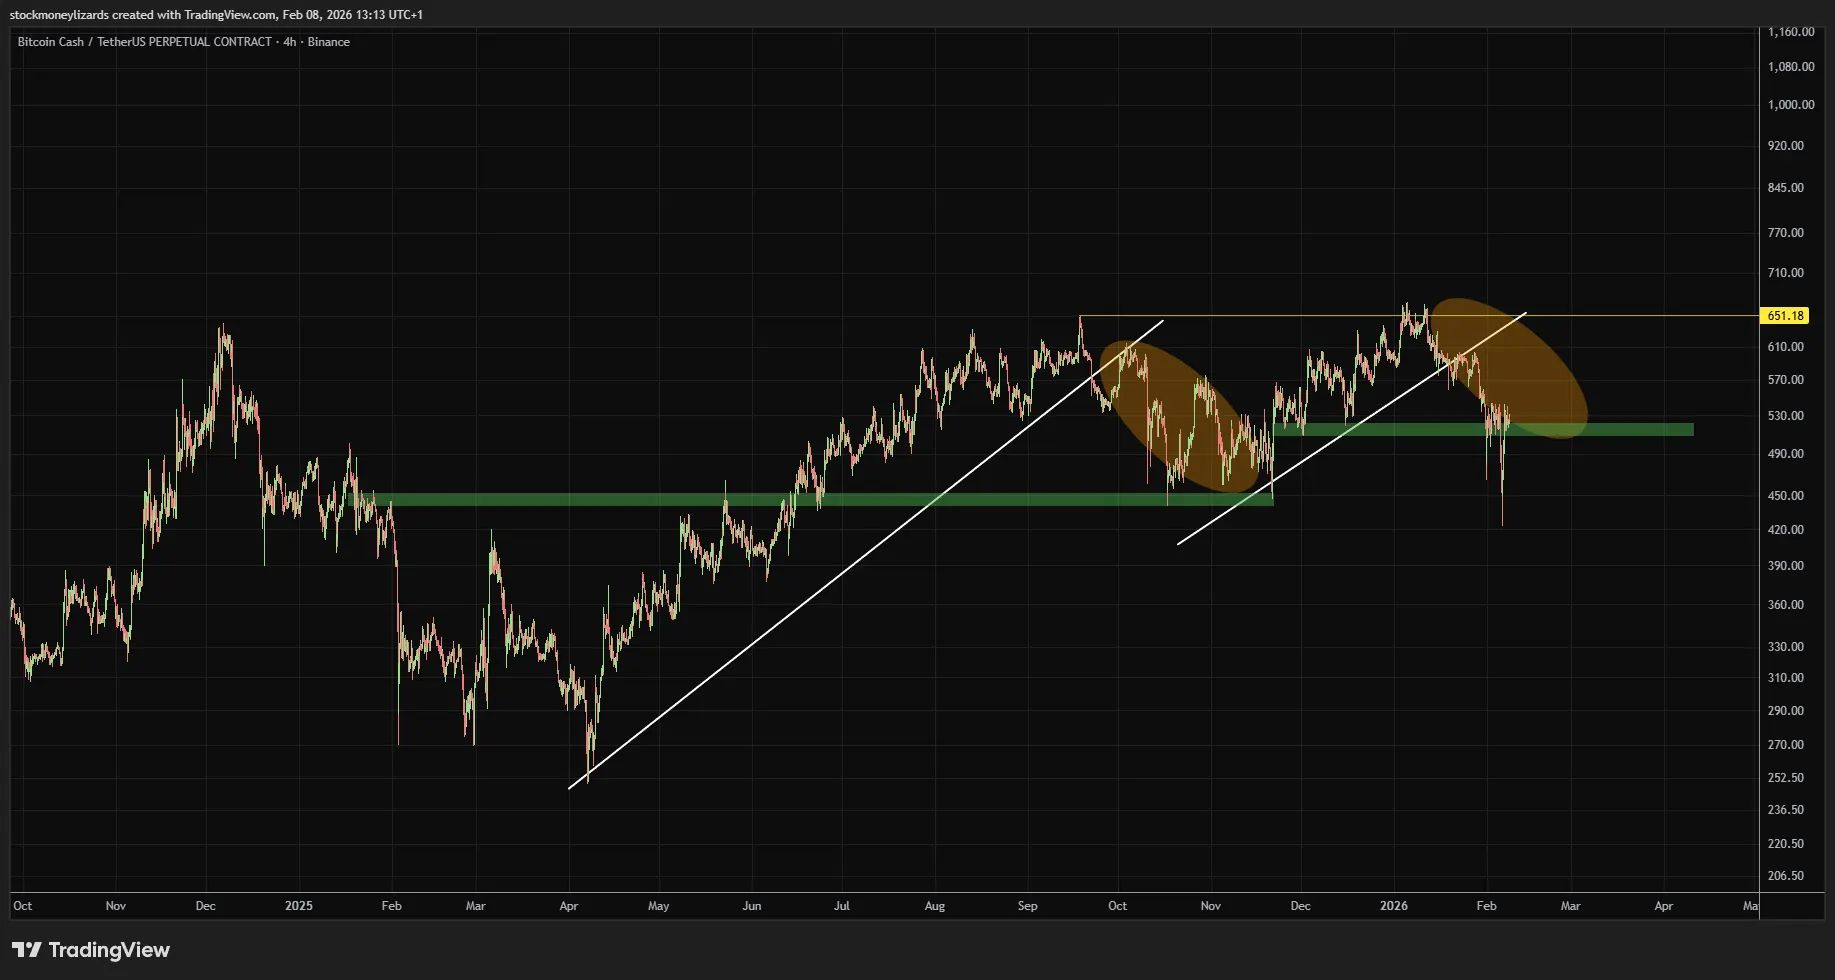
Bitcoin Cash (BCH): Liquidity target swept; now back inside a higher-timeframe support zone. Dips into this area are of interest, assuming BTC stabilizes.

🧪 Lab Note of the Week
This is the phase where mean reversion and level-based trading outperform trend chasing.
We’re focused on:
Avoiding late shorts after panic moves
Letting price come to us at predefined levels
Treating bounces as trades, not trend reversals
The market is offering opportunity - just not in a hurry.
⚠️ Disclaimer
This newsletter is for informational and educational purposes only. We have positions in the assets discussed here. It does not constitute financial advice, trading advice, or investment recommendations. Any market commentary, analysis, charts, or outlooks reflect our personal opinions and are not guarantees of future performance.
Cryptocurrency trading involves significant risk and may not be suitable for all investors. Always conduct your own research and consider your risk tolerance before making trading decisions. The Lab, its contributors, and its systems (SML1/SML2/SML3) do not take responsibility for losses incurred from trades based on this content.
📚 Appendix - About The Lab
Core Systems
SML1: Mean reversion & volatility extremes
SML2: Support / resistance reactions
SML3: Breakouts & trend transitions
Traders
Chris (Stockmoney Lizards): Macro & structure
Cryptex Guy: Fibonacci precision
Bitcoin Wizard: Sentiment & psychology
🧮 How We Measure Performance at The Lab
All performance is tracked using R-based results, a professional risk-adjusted metric used by systematic traders.
1R = 1 unit of risk, defined by the distance between entry and stop-loss.
A trade that returns +2R means it earned 2× the initial risk.
A trade that returns –1R means the full risk unit was lost.
Why this matters:
It normalizes all trades, regardless of position size or asset.
It prevents emotional interpretation of wins/losses.
It shows true system performance over time.
It allows us to compare trades and weeks on the same scale.
Our weekly and monthly stats reflect the net sum of R across all closed trades.
This ensures the results remain objective, consistent, and comparable across all market conditions.